
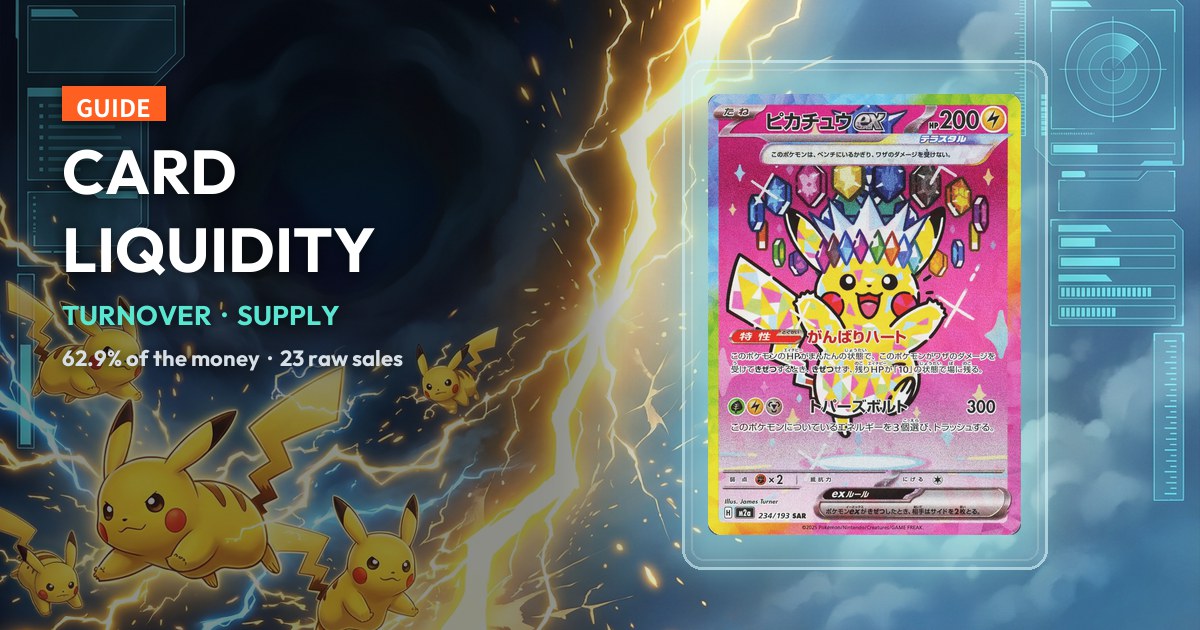
A set’s money is not spread evenly. Take MEGA Dream ex: its five highest-turnover cards this week total ¥1,463,378, and ¥921,081 of that — 62.9% — sits on the Pikachu ex alone. Second place is ¥440,797, and third falls straight to ¥41,000. But the figures that actually decide whether you can buy one are different: across those same five cards, ungraded sales this week total just 58, against 502 PSA 10 sales. Which means most people who want the most-wanted card end up buying it graded.
The short version
- The money concentrates in one or two cards. The Pikachu ex SAR took 62.9% of the top five’s combined turnover and is 2.1× second place; third place then drops to under a tenth of second.
- The volume is almost all in the graded tier. These five cards saw 502 PSA 10 sales this week against only 58 ungraded — 8.7× as many.
- So “most wanted” and “easiest to buy” are different properties. The turnover leader had just 23 ungraded sales this week; the card with the most PSA 10 sales (224) had only 5.
Liquidity: where a set’s money sits, and where its volume sits
Turnover and sale count answer two different questions — the first is where the money went, the second is how many people traded. Those definitions are unpacked in turnover vs sale count. This post puts the same data to a third question: if I want one now, can I get it?
Take the money first. The five cards below total ¥1,463,378 in turnover this week, and ¥921,081 of it — 62.9% — belongs to card 1. Card 2 is ¥440,797, so the gap between them is 2.1×. Card 3 then falls to ¥41,000, under a tenth of card 2: the cliff. A cliff does not mean nobody wants the cards below it; it means the money and the attention are concentrated in the top two.
Now take the volume, which points the other way. Across the same five cards and the same week, PSA 10 sales total 502 against 58 ungraded — 8.7× as many. In other words this set’s high-rarity cards (SAR — see what the rarity labels mean) circulate mainly in graded form, and the ungraded supply is a trickle.
Put the two together and there is a conclusion a buyer can act on: the most-wanted card is usually not the easiest one to buy. Card 1 had 23 ungraded sales this week and card 5 had 5, against 224 PSA 10 sales. Wanting an ungraded copy means accepting thin supply, a wait, and a “market price” resting on very few sales. Wanting one now usually means the graded route, and paying the grading premium. When supply is this thin, bidding is often how a copy is actually secured.
Two limits to state plainly. First, this covers only the five highest-turnover cards, not the whole set — 62.9% is a share OF THOSE FIVE, not of the set. Second, the source notes explicitly that a sales-to-listings ratio needs listing-volume data that does not exist yet, so no turnover rate or sell-through figure is inferred anywhere here.
Top 5 by turnover: where the money is, where the volume is
-
#1
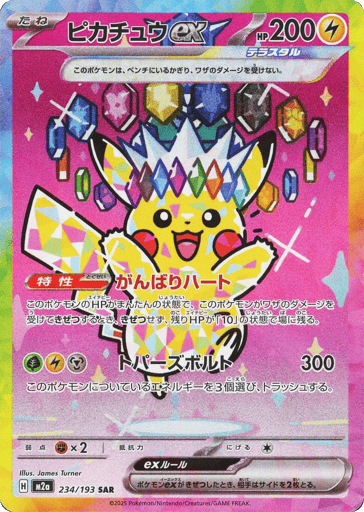
M2a 234/193・2025 Pikachu ex SAR
ピカチュウex SAR
M2a 234/193 · Special Art Rare (SAR)
ハイクラスパック「MEGAドリームex」
MEGA Dream ex (high-class pack)
Turnover this week ¥921,081
30-day median (ungraded)
¥40,000
4-week trend (ungraded VWAP; sale count beneath)
Search this card on Collect2Day ›How liquid is this card?
¥921,081 in turnover this week — 62.9% of the five combined, and 2.1× card 2. That is a high degree of concentration. On price: an ungraded median of ¥40,000 and VWAP of ¥40,047 on 23 sales, down 1.9% for the week; PSA 10 at a ¥71,900 median and ¥73,809 VWAP on 96 sales, down 2.1%. The two falls are actually similar — the real difference is volume, with PSA 10 carrying more than four times the sales. Most people who wanted this card ended up transacting in the graded market rather than waiting for an ungraded copy. That volume structure is precisely why buying a clean ungraded copy directly in Japan is so hard.
-
#2
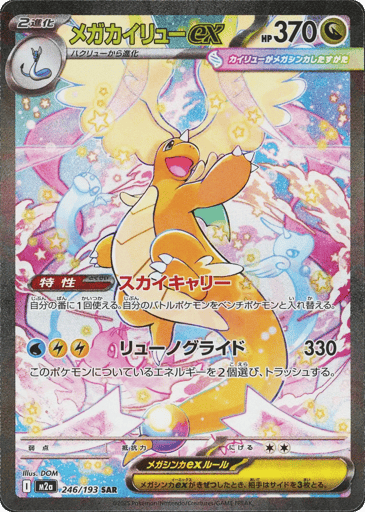
M2a 246/193・2025 Mega Dragonite ex SAR
メガカイリューex SAR
M2a 246/193 · Special Art Rare (SAR)
ハイクラスパック「MEGAドリームex」
MEGA Dream ex (high-class pack)
Turnover this week ¥440,797
30-day median (ungraded)
¥27,300
4-week trend (ungraded VWAP; sale count beneath)
Search this card on Collect2Day ›How liquid is this card?
¥440,797 this week, second place — well behind the leader but far ahead of everything under it. Its two tiers are not moving together: ungraded sits at a ¥27,300 median and ¥27,550 VWAP, up 6.1% for the week, but on only 16 sales; PSA 10 is at a ¥45,000 median and ¥45,737 VWAP, down 3.7%, on a thick 141 sales. The ungraded sale count is roughly a ninth of the graded one. A common explanation is that a sizeable share of copies go straight to grading after being pulled, locking in condition before resale — there is no grading-submission data here to confirm that, so it stays one explanation among possibilities. What it means for a buyer: on this card, sourcing an ungraded copy is a harder problem than the price is.
-
#3
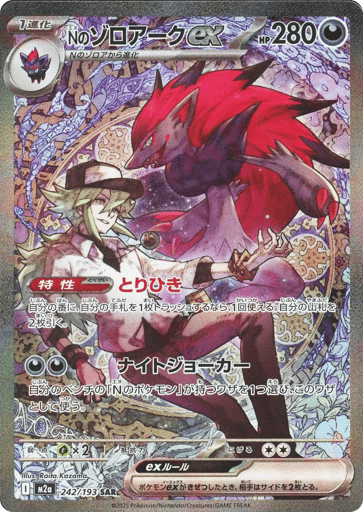
M2a 242/193・2025 N’s Zoroark ex SAR
Nのゾロアークex SAR
M2a 242/193 · Special Art Rare (SAR)
ハイクラスパック「MEGAドリームex」
MEGA Dream ex (high-class pack)
Turnover this week ¥41,000
30-day median (ungraded)
¥6,900
4-week trend (ungraded VWAP; sale count beneath)
Search this card on Collect2Day ›How liquid is this card?
¥41,000 this week — and this is where the cliff starts, more than ten times below card 2. A cliff does not mean nobody wants it; it means liquidity is thin. Ungraded managed just 6 sales for the whole week at a ¥6,900 median and ¥6,833 VWAP, up 2.8%; PSA 10 had 28, at a ¥14,600 median and ¥14,649 VWAP, down 10.7%. Note that the 10.7% rests on 28 sales, which is not thick enough to read as a trend. For anyone starting on this set’s SARs it is the cheapest SAR on the list, and the cost of that is waiting for stock.
-
#4
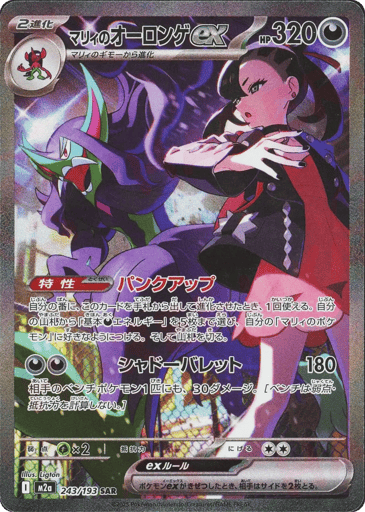
M2a 243/193・2025 Marnie’s Grimmsnarl ex SAR
マリィのオーロンゲex SAR
M2a 243/193 · Special Art Rare (SAR)
ハイクラスパック「MEGAドリームex」
MEGA Dream ex (high-class pack)
Turnover this week ¥31,900
30-day median (ungraded)
¥4,000
4-week trend (ungraded VWAP; sale count beneath)
Search this card on Collect2Day ›How liquid is this card?
¥31,900 this week, fourth, and the most sharply split card on the list. Ungraded is up 12.6% for the week at a ¥4,000 median and ¥3,988 VWAP on 8 sales; PSA 10 is down 14.4% at a ¥10,000 median and ¥10,039 VWAP on just 13. Both sale counts are in single or low double digits — on samples that small a handful of sales is enough to move the whole median, so neither percentage should be read as a trend. What is worth noting is the entry point: at the ¥4,000 level this is already the most accessible SAR in a high-class pack.
-
#5
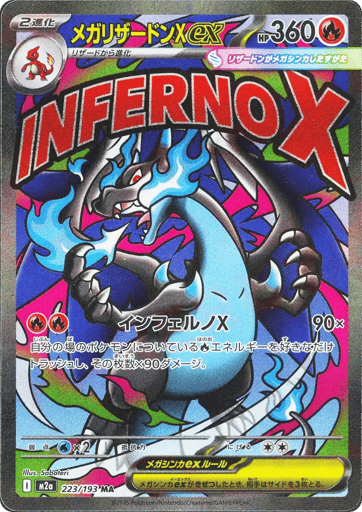
M2a 223/193・2025 Mega Charizard X ex MA
メガリザードンXex MA
M2a 223/193 · Mega Attack Rare (MA)
ハイクラスパック「MEGAドリームex」
MEGA Dream ex (high-class pack)
Turnover this week ¥28,600
30-day median (ungraded)
¥5,500
4-week trend (ungraded VWAP; sale count beneath)
Search this card on Collect2Day ›How liquid is this card?
¥28,600 this week, the lowest on the list — but its trading structure is unlike the four above it. It is an MA rather than an SAR, pulled at a relatively higher rate, so the unit price is naturally lower: an ungraded median of ¥5,500 and VWAP of ¥5,720, up 2.1%, on only 5 sales for the entire week, the thinnest group here. The striking side is PSA 10: 224 sales in a week, the most on the list, making graded volume roughly 45× ungraded. Its median is ¥15,000 and it is down just 1.2%, but the VWAP reaches ¥19,524 — and that gap means a set of higher sales is pulling the average up, so the median alone understates the range. This card runs on high volume, a low unit price and graded circulation, the exact opposite of card 1’s concentrated money, which makes it a fitting close to a cliff-shaped list.
Three questions to ask before assuming you can buy one
Frequently asked
Why is the most wanted card the hardest one to buy?
Because the volume is concentrated in the graded market. Card 1 here had 23 ungraded sales this week against 96 PSA 10; card 5 is more extreme still, at 5 against 224. The ungraded supply is a trickle, so an ungraded copy usually means waiting — or switching to a graded one.
What is the difference between turnover and sale count?
Turnover is sale count multiplied by unit price, and answers where the money went. Sale count answers how many people traded. A high-priced, low-volume card can post large turnover while being very illiquid.
Is that 62.9% a share of the whole set?
No. This covers only the five highest-turnover cards of the week, so 62.9% is a share of those five. The source also states explicitly that a sales-to-listings ratio needs listing-volume data it does not yet have, so no sell-through rate is inferred here.
Can these figures be used to predict prices?
This post makes no prediction. Several of these cards have sale counts in single or low double digits, and a percentage on a sample that small is closer to noise. The figures are useful for judging whether you can buy one right now, and roughly what it would cost.
See live stock from this set on Collect2Day
Collect2Day connects directly to the Japanese market, so you buy at local Japanese prices and consolidate everything into one cross-border shipment.
Search this setPrices here are reference figures from Japanese-market sales, quoted in yen, and are for comparison only. Live pricing moves; the figure on the Collect2Day page is the one that applies.