

A Pokémon card is down 47.8% over thirty days. That sounds like a collapse. The same card is up 10% over the last week — on six sales. Both numbers are accurate and they point in opposite directions. The problem is not bad data; a single percentage was never enough to tell you where a card stands. Below are five Japanese-market cards that all fell in the same period, each with its full tier and four-week data, and the three questions they force you to ask.
The short version
- Ask which tier fell. Ungraded and PSA 10 are separate markets — one can slide while the other holds, on the same card.
- Ask how thick the volume is. A +10% built on six sales and a −1.8% across 309 sales are not the same class of evidence.
- Ask which window it covers. “Flat this week” and “down 30% this month” can both be true at once.
Why one percentage is never enough
For a price change to mean anything it has to carry three things: which condition tier the price belongs to, how many sales produced it, and what period it compares. Drop any one and the same figure supports opposite readings.
The five cards below all fell in the same window, between −26.7% and −47.8%. Each carries its PSA 10 row and a four-week trend, so the three questions can be answered against the numbers rather than asserted. All five come from two Japanese sets, M2a “MEGA Dream ex” and M5 “Abyss Eye”. Every figure is the Japanese market in yen, with no currency conversion.
Five cards, in full
-
#1
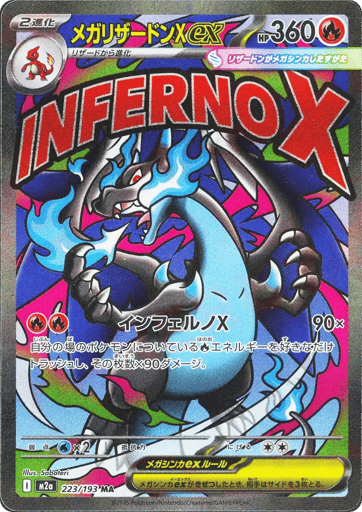
M2a 223/193・2025 メガリザードンXex MA
Mega Charizard X ex MA
M2a 223/193 · Mega Attack Rare
High class pack “MEGA Dream ex”
30d −26.7%
30-day median (ungraded)
¥6,300
4-week trend (ungraded VWAP; sale count beneath)
Find this card on Collect2Day ›What this card demonstrates
The most-traded ungraded card of the five at 34 sales in the week, and the price fell anyway. Thick volume matters: the fall was not assembled from a handful of odd sales. Split by tier it is clearer — PSA 10 moved just −1.8% across 309 sales, so the pressure sat on the ungraded side. Note that “most sales” counts ungraded only; the 309 graded sales are a different market.
-
#2
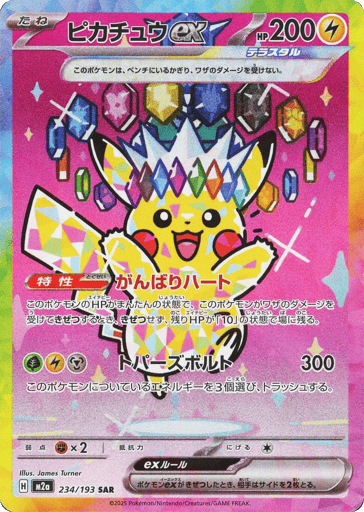
M2a 234/193・2025 ピカチュウex SAR
Pikachu ex SAR
M2a 234/193 · Special Art Rare (SAR)
High class pack “MEGA Dream ex”
30d −29.7%
30-day median (ungraded)
¥42,000
4-week trend (ungraded VWAP; sale count beneath)
Find this card on Collect2Day ›What this card demonstrates
Up 0.4% on the week, so steady on a short view — but −29.7% over thirty days, a deeper fall than card 1. “Barely moved this week” and “down almost a third this month” are both true; which you meet depends on the window you are shown. PSA 10 fell 6.0% here, steeper than ungraded — the mirror image of card 1.
-
#3
M5 114/081・2026 メガダークライex SAR
Mega Darkrai ex SAR
M5 114/081 · Special Art Rare (SAR)
Expansion “Abyss Eye”
30d −35.4%
30-day median (ungraded)
¥37,000
4-week trend (ungraded VWAP; sale count beneath)
Find this card on Collect2Day ›What this card demonstrates
Down 35.4% over thirty days but structurally inverted: ungraded moved only −1.8% while PSA 10 fell 27.4%. With 109 graded sales behind it, that is unlikely to be one or two strange prices. More PSA 10 copies in circulation would compress the premium, but there is no submission or supply data here to test it, so that stays a hypothesis.
-
#4
M5 117/081・2026 ムク SAR
Mukku SAR
M5 117/081 · Special Art Rare (SAR)
Expansion “Abyss Eye”
30d −43.1%
30-day median (ungraded)
¥4,980
4-week trend (ungraded VWAP; sale count beneath)
Find this card on Collect2Day ›What this card demonstrates
Down 43.1%, the second-deepest — but the number that matters is the sample. Eleven ungraded sales in the week, and no usable PSA 10 data at all, which is why the graded row is absent above. On a thinly traded card every sale moves the median, so both the −43.1% and the −3.0% carry less weight than the cards above.
-
#5
M5 108/081・2026 カスミの元気 SR
Misty’s Determination SR
M5 108/081 · Super Rare (SR)
Expansion “Abyss Eye”
30d −47.8%
30-day median (ungraded)
¥2,490
4-week trend (ungraded VWAP; sale count beneath)
Find this card on Collect2Day ›What this card demonstrates
Down 47.8% over thirty days, the steepest here, yet up 10% on the week — across six sales. The “6” in the last column of the table matters far more than the “+10%”. Topping a drop list does not mean a card is about to recover, and a one-week bounce does not mean it has bottomed.


Three questions to ask of any price change
FAQ
Why separate ungraded and PSA 10 prices at all?
They are different products. Ungraded is the card itself; PSA 10 is that card encapsulated by a third-party grader at the top of its scale. Among the five here, two fell mainly on the ungraded side and one mainly on the graded side — blend the tiers and that difference disappears.
How few sales is too few to trust?
There is no hard line, but the contrast is instructive: six sales produced +10% on card 5, while 309 produced −1.8% on card 1. The fewer the sales, the more a single transaction drags the median.
Is the biggest faller the best buy?
Not investment advice, but the data makes one point clearly: the steepest faller here is also the thinnest-traded, which makes its percentage the least reliable of the five.
Why does this article not explain the causes?
Because the data cannot support causal claims. The figures here are sale prices and sale counts only — no supply or submission volumes. Anything about cause is labelled a hypothesis.
Find these cards on Collect2Day
Collect2Day buys direct from the Japanese market, so you pay Japanese prices and ship everything home in one consolidated parcel.
Start searchingPrices here are reference figures from Japanese market sales and are for comparison only. Live pricing moves; the figure on the Collect2Day page is the one that applies.